How Much Does Each Degree Cost the Argentine Grid?
First study of the series “Reading the SADI with data”, on the Argentine Interconnected System (SADI).
¿Cuántos MW le suma a la red argentina cada grado de calor o de frío? Con cinco años y medio de demanda horaria de las 22 provincias (CAMMESA) y datos meteorológicos:
- Entre 16,3 y 20,5 °C la demanda no depende de la temperatura.
- Cada grado de calor suma 816 MW (5,6 % de la demanda base); cada grado de frío, 512 MW (3,5 %).
- El efecto del calor es máximo a las 16 h: 1.284 MW por grado.
- El NEA es la región más sensible al calor. Al frío responden mucho más las provincias con poca cobertura de gas de red, incluido el AMBA, que las del sur y Cuyo.
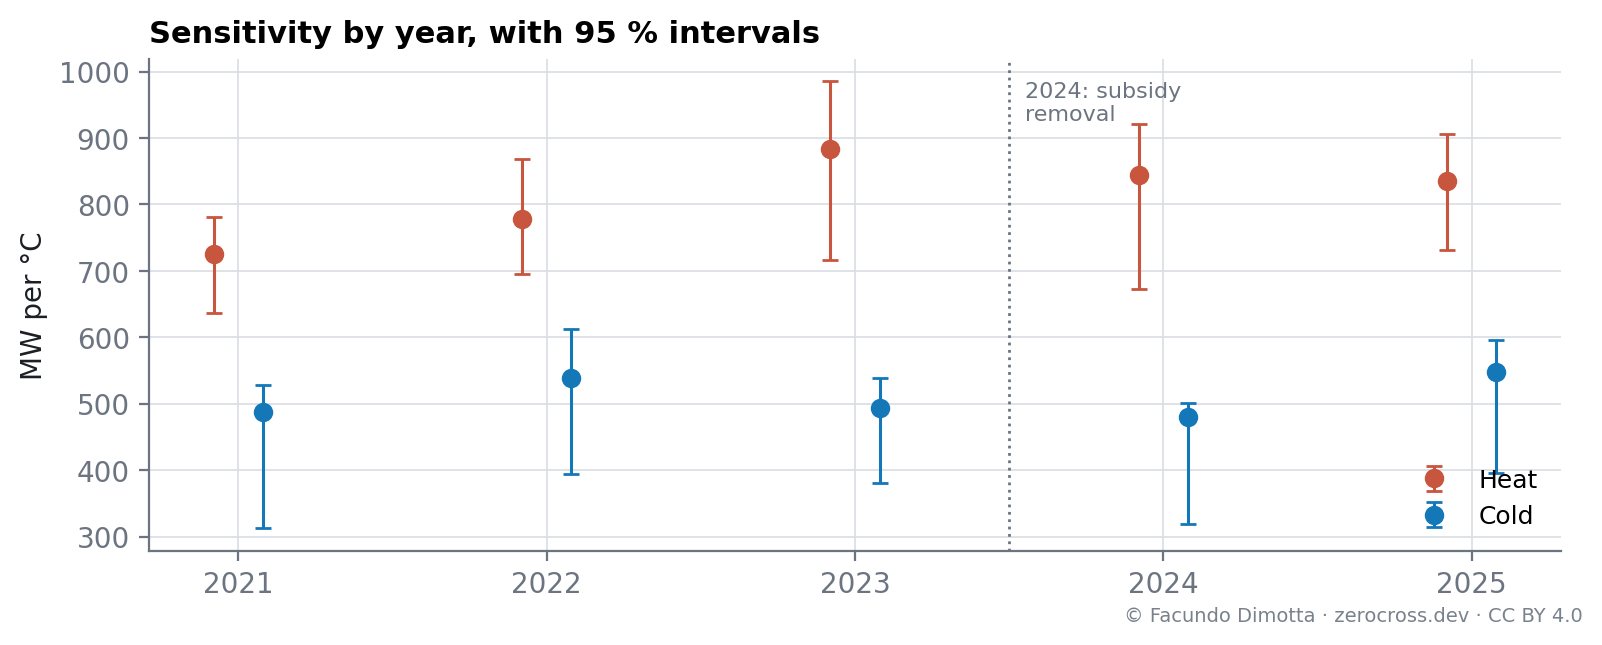
- Con estos datos, las subas de tarifas de 2024 no cambiaron de forma medible la respuesta a la temperatura.
The question
Electricity demand in Argentina follows the weather: air conditioning in summer, heating in winter. Everyone in the sector knows it qualitatively. The questions here are quantitative: from what temperature does demand start to grow, how many MW does each degree add, at what time of day, in which provinces, and did the tariff increases of 2024 change the response?
Data and method
- Demand: hourly energy of the 22 provinces connected to the SADI, from CAMMESA, January 2021 to July 2026. 2020 is excluded because the pandemic distorted consumption.
- Weather: hourly temperature at 2 m from the ERA5 reanalysis (Copernicus), via Open-Meteo, at the main city of each province.
- National temperature: each province’s temperature weighted by its share of the energy. Buenos Aires accounts for 49 % of the weight, Santa Fe for 9 % and Córdoba for 8 %.
For each day, the model explains the energy with a level per year (growth and economic activity), a term for non-working days, and two slopes: one for each degree below a lower breakpoint and one for each degree above an upper breakpoint.
E_d = a_{\text{year}} + b\,\text{[non-working]} + c_{\text{cold}}\,\max(T_c - T_d,\,0) + c_{\text{heat}}\,\max(T_d - T_h,\,0)
The breakpoints Tc and Th are estimated from the data. Confidence intervals come from a block bootstrap by month, which respects the fact that consecutive days are not independent.
Results
The national curve
The fit explains 88 % of the daily variation (2,038 days). Between 16.3 and 20.5 °C demand does not depend on temperature. Outside that band:
| MW per °C | 95 % interval | % of base demand per °C | |
|---|---|---|---|
| Heat (above 20.5 °C) | 816 | 773 – 857 | 5.6 % |
| Cold (below 16.3 °C) | 512 | 472 – 534 | 3.5 % |
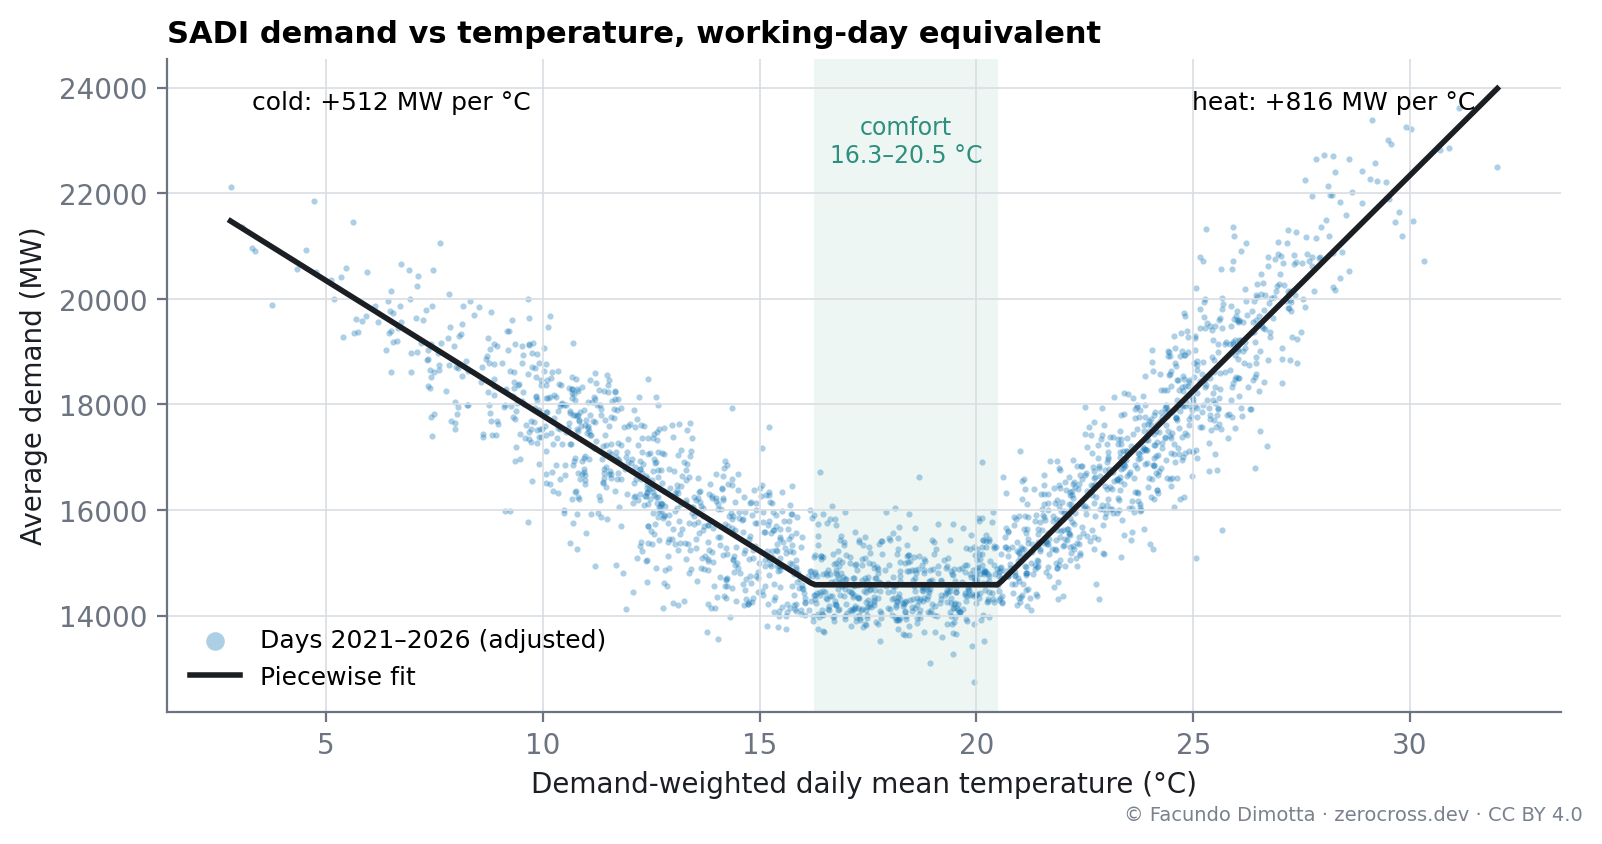
To put 816 MW in context: it is about the output of a large combined-cycle plant. A forecast error of one degree on a hot day moves the system by that amount.
Hour by hour
The heat response is concentrated in the afternoon: it peaks at the hour ending at 16 h, with 1,284 MW per °C, and falls to 410 MW per °C at 8 h. The cold response has two peaks: mid-morning (about 600 MW per °C) and, above all, the evening, between 20 and 23 h (about 690 MW per °C).
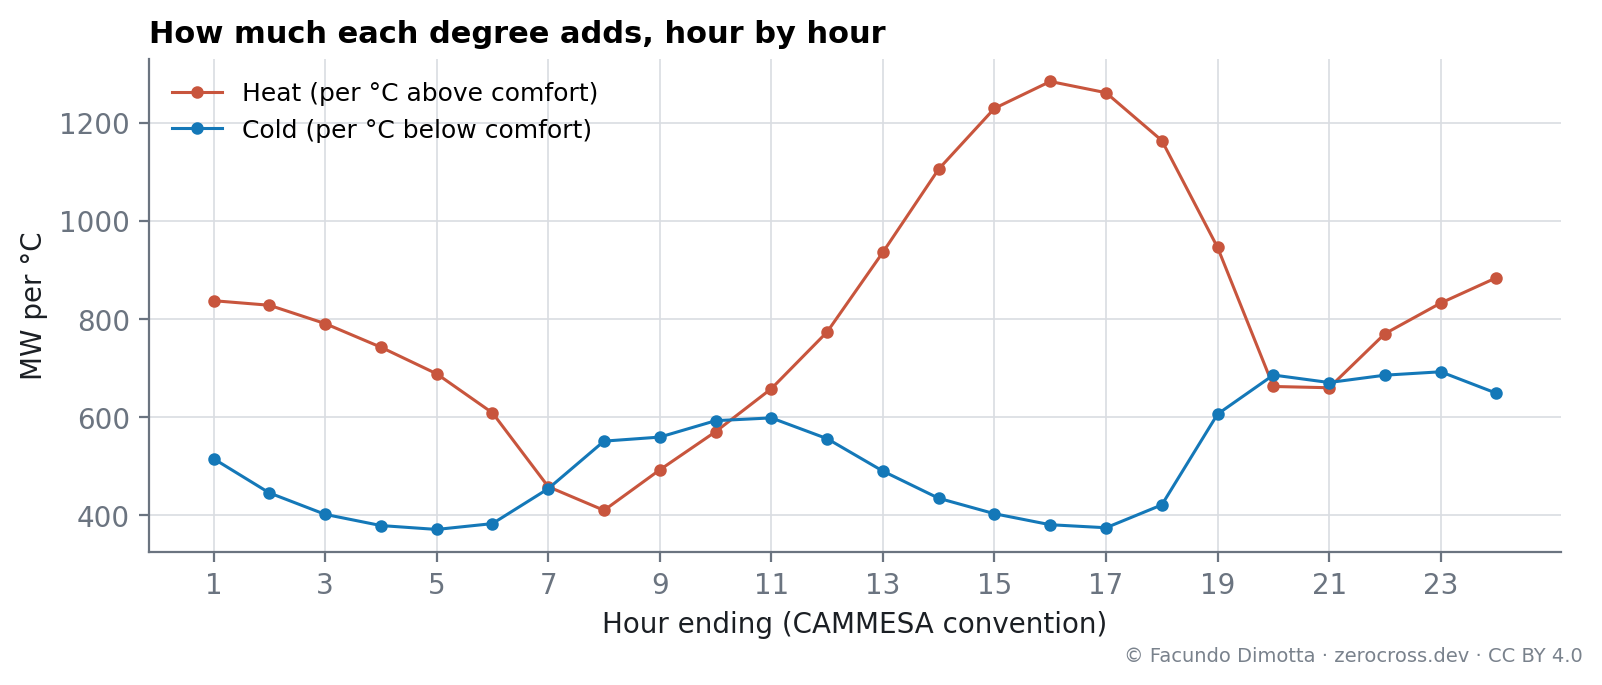
This matters for the peaks: the system’s summer maximum happens in the afternoon, exactly when each degree weighs the most.
By province
Normalizing by each province’s own base demand makes them comparable. The hottest provinces of the north-east, Santiago del Estero, Chaco, Formosa and Corrientes, add between 10.6 and 11.5 % of their base demand per degree of heat.
The cold response tells another story. The same north-eastern provinces add 4.6 to 5.5 % per degree of cold, while Mendoza, Neuquén, Río Negro and La Pampa add between 1.1 and 1.6 %. This is consistent with heating being electric where the natural gas network reaches fewer homes and gas-fired where it is widespread. Buenos Aires, with 4.5 % per degree of cold, fits the same pattern: according to the 2022 census, about 41 % of households in the Greater Buenos Aires districts and 21.5 % in the City had no natural gas connection, up from 35.8 % and 2.9 % in 2001, and many new buildings are all-electric (figures compiled by the Observatorio del Conurbano, UNGS, as reported by EconoJournal). The data are consistent with that explanation, but they do not prove it by themselves.
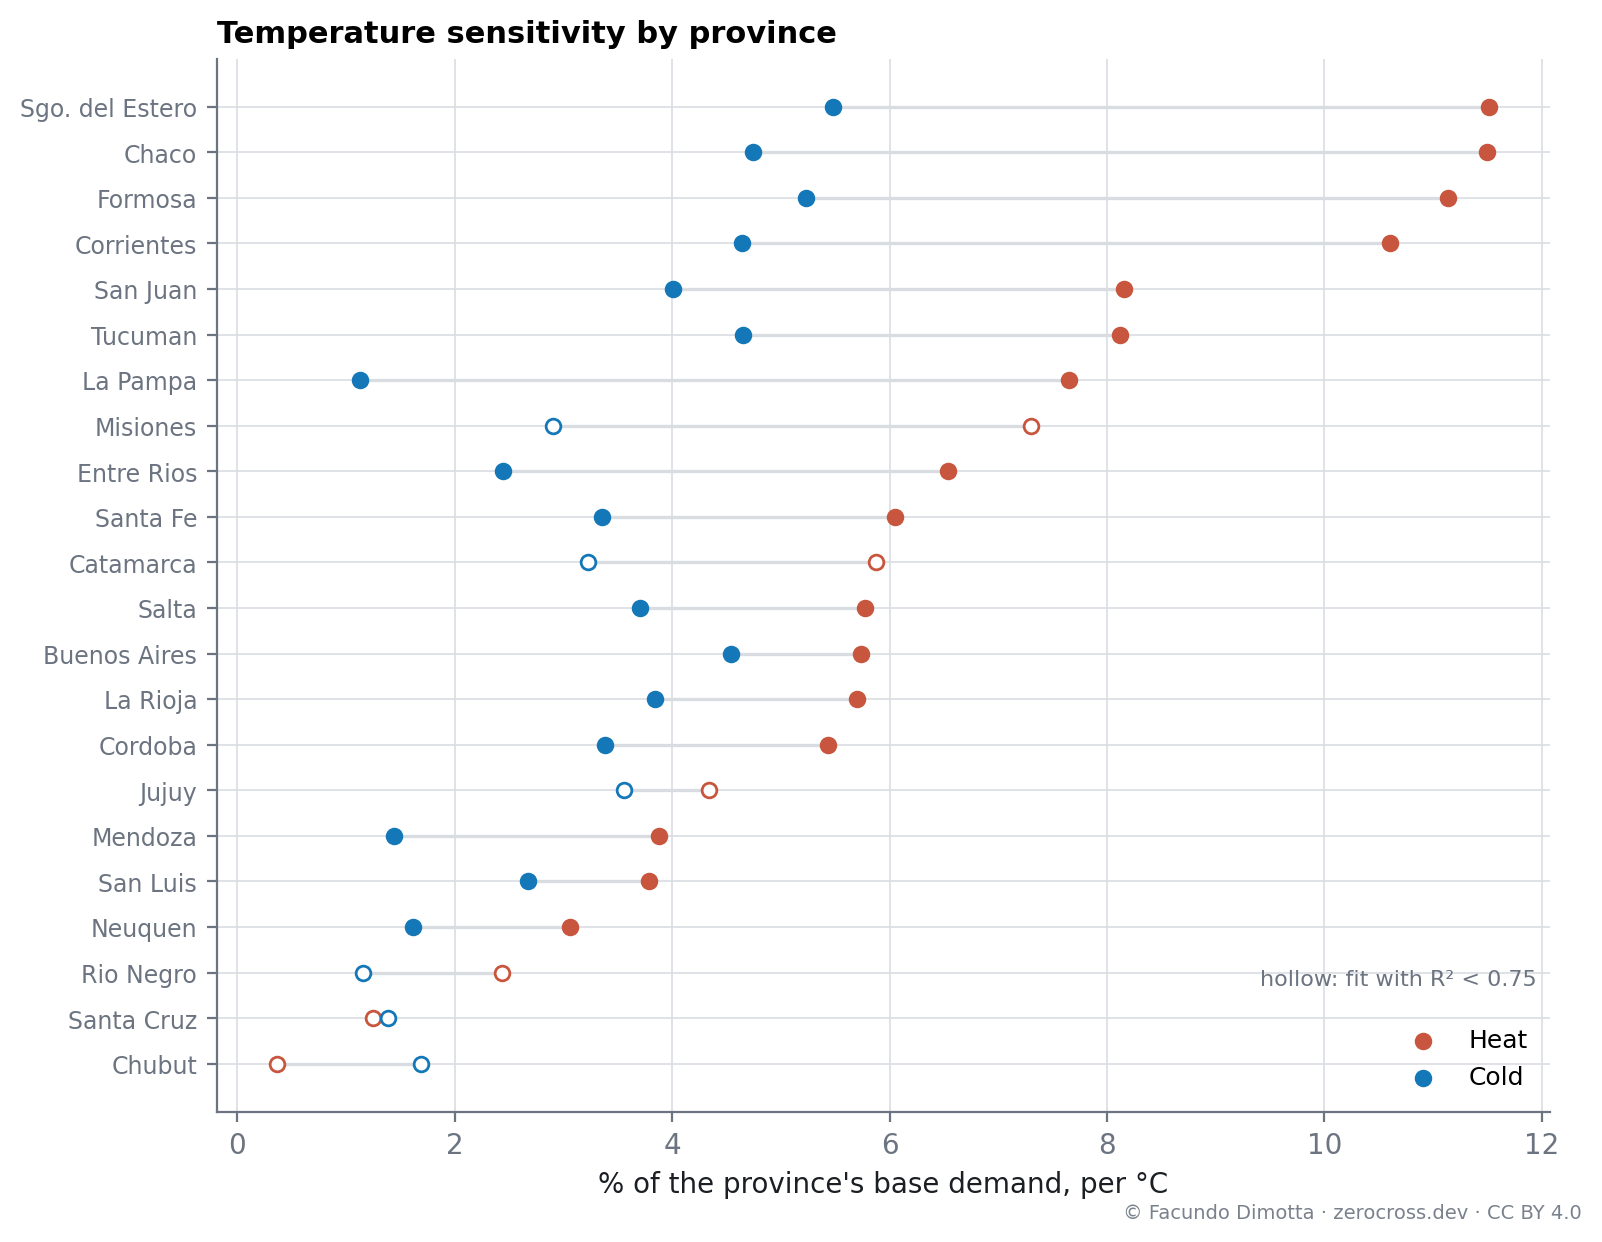
Chubut and Santa Cruz barely respond to temperature: their demand is dominated by large industrial users, such as the aluminum smelter in Puerto Madryn, and the fit is poor (hollow markers).
Did 2024 change anything?
The intervals by year overlap widely. Heat sensitivity went from 725 MW per °C in 2021 to 835–884 MW per °C between 2023 and 2025, and cold sensitivity stayed between 480 and 550 MW per °C. With these data, a change after the 2024 tariff increases cannot be distinguished from year-to-year variability. The subsidy removal lowered the level of demand in 2024, but not measurably its response to temperature.
Discussion
- Temperature is the main short-term driver of demand, and its effect is asymmetric: each degree of heat adds 60 % more than each degree of cold.
- For forecasting, one degree of error in the afternoon of a hot day is worth more than 1 GW. That is the starting point of the next study in the series: a day-ahead demand forecast.
- For distribution planning, the provincial differences show why a single national load profile is not enough: the same weather produces very different responses depending on the climate, the industry and the availability of gas.
Limitations
- One weather point per province, at its main city. For Río Negro that point is Viedma, while most of the demand is in the Alto Valle.
- Daily mean temperature ignores humidity and the accumulation of heat over consecutive days, both known to increase the response.
- ERA5 is a reanalysis: smoother than station measurements, especially for extremes.
- Demand includes large industrial users, whose consumption hardly depends on the weather.
Data: CAMMESA, Base del Informe Mensual. Open-Meteo.com and ERA5, Copernicus Climate Change Service (CC BY 4.0).
Reuse
Citation
@online{dimotta2026,
  author = {Dimotta, Facundo},
  title = {How {Much} {Does} {Each} {Degree} {Cost} the {Argentine}
    {Grid?}},
  date = {2026-09-29},
  url = {https://zerocross.dev/posts/2026-09-29-sadi-temperature-demand/},
  langid = {en}
}