Is the Argentine Load Curve Flattening? Ten Hypotheses Tested

Third study of the series “Reading the SADI with data”.
La demanda sigue creciendo, pero los picos de verano dejaron de subir. ¿Se está aplanando la curva de carga? Seis años de datos horarios del SADI, diez hipótesis puestas a prueba:
- Hasta 2025 la curva se volvió más puntiaguda: el factor de carga bajó de 0,61 a 0,57.
- El pico bajo del verano 2026 fue sobre todo clima: a igual calor, apenas unos 300 MW menos que en 2025.
- El cambio de fondo: a igual calor, la demanda de las tardes de verano dejó de crecer desde 2022/23, sobre todo en las distribuidoras, mientras el resto de la curva siguió subiendo.
- Descartadas o sin señal medible: solar detrás del medidor, precio horario, LED, aires inverter, turnos nocturnos. El aire acondicionado en noches tropicales sí eleva la base.
- La explicación más coherente es el tamaño de la factura en hogares y comercios desde 2024, no el precio horario.
The question
Two observations from the previous studies did not fit together. Demand in the Argentine interconnected system keeps growing: the day-ahead forecast under-predicted 2026 because the level of demand jumped. Yet the highest hour of summer 2026 was about 8 % below that of 2025.
Is the load curve flattening, with the base rising and the peaks stalling? And if so, why? This study tests ten hypotheses that are often mentioned in the sector.
Data
- Hourly demand of the SADI split into large users of the wholesale market (MEM) and distributors, January 2020 to July 2026. Smaller large users (GUME) are included in the distributors’ figure.
- Monthly demand by agent, with its tariff category (residential, commercial, large industrial and commercial).
- Hourly marginal cost of the MEM.
- Hourly weather (ERA5, via Open-Meteo), weighted by each province’s share of demand, as in the first study.
A note on peaks. Throughout this study, “demand” is the hourly energy of the 22 provinces (MWh in the hour, equal to the average MW of that hour), which excludes transmission losses. It is therefore lower than the figures usually quoted for records: the official record of the system, 30,257 MW in February 2025 (published in the Ministerio de Economía series Demanda de electricidad), is an instantaneous value of total demand, including losses. Both are correct; they measure different things.
Results
Until 2025 the curve got peakier, not flatter
Between 2020 and 2025 the annual peak grew about 17 %, faster than the mean (about 11 %). The load factor, the ratio between mean and peak, fell from 0.61 to 0.57 (Figure 1). Seen year by year, the system was becoming more peak-driven.
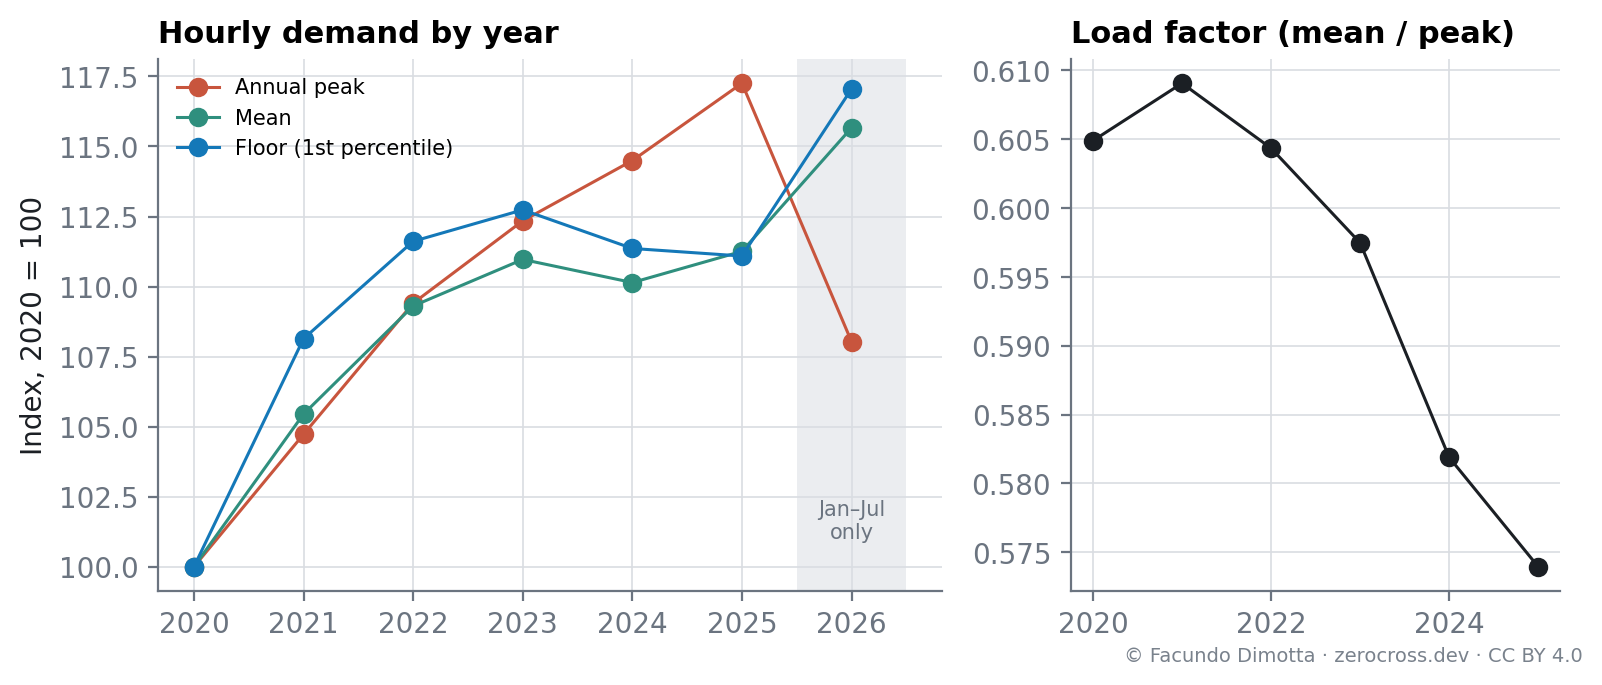
The low peak of 2026 was mostly weather
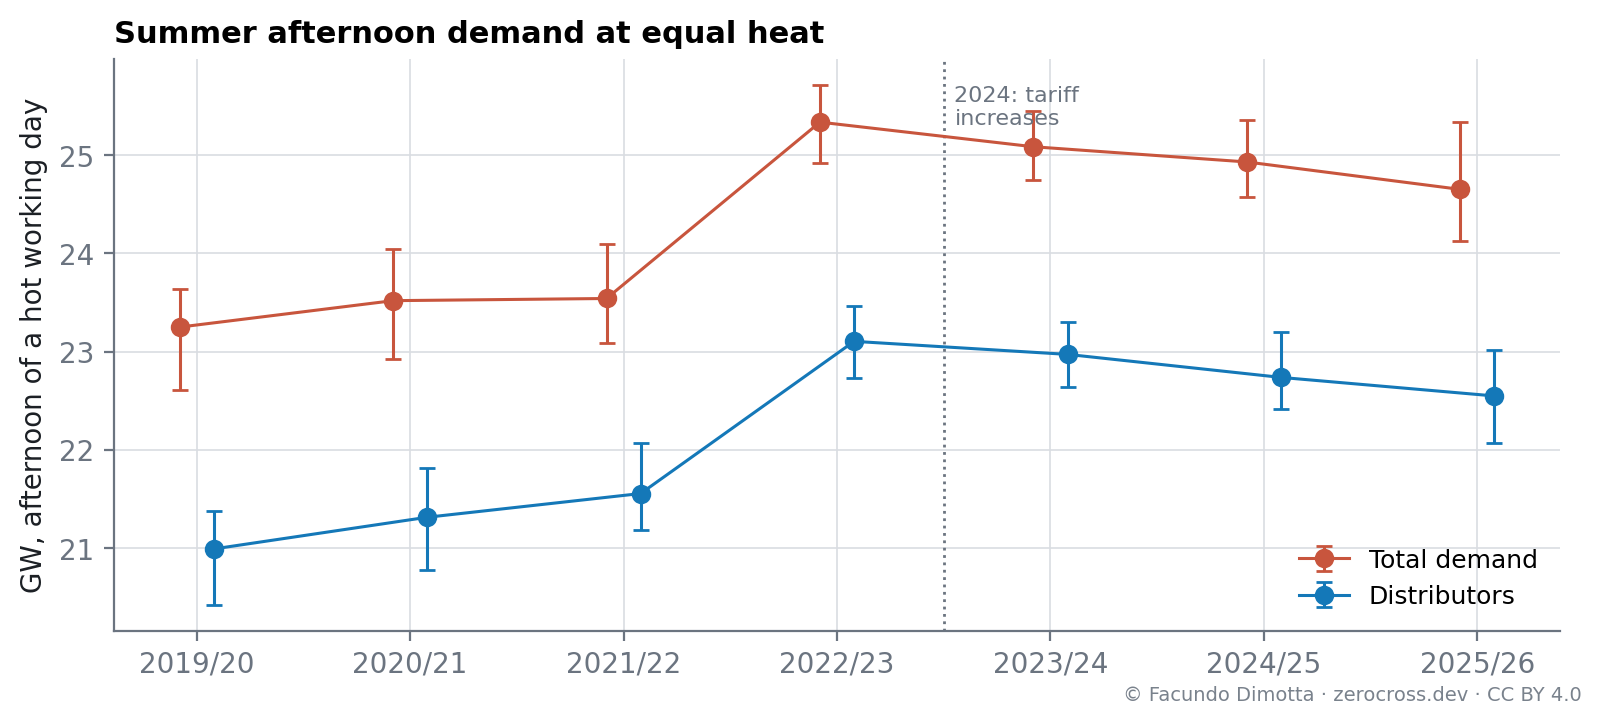
A record peak depends on the exact day and hour of the most extreme heat, so comparing records says little. A fairer comparison is demand at equal heat: the afternoon demand of a hot working day at the same reference temperature, estimated for each summer from its own hot days (Figure 2).
At equal heat, summer 2025/26 is only about 300 MW below 2024/25, well within the uncertainty. Most of the difference between the two summers’ highest hours was weather, not a change in behavior.
But afternoon demand at equal heat stopped growing after 2022/23
The same figure shows a different, more durable change. At equal heat, summer afternoon demand rose from 23.3 GW (2019/20) to 25.3 GW (2022/23), and then stopped growing: 25.1, 24.9 and 24.7 GW in the following summers. The slight decline is within the uncertainty; the plateau is not. Almost all of it is in the distributors, which went from 23.1 to 22.6 GW over the same period.
Meanwhile the level of demand kept growing. Corrected for weather with the model of the first study, the average working-day demand rose about 2 % between 2023 and 2026, with a dip in 2024. The peak stalled while the rest of the curve kept rising: that is the flattening, and it started around 2023/24, not in 2026.
Who consumes less
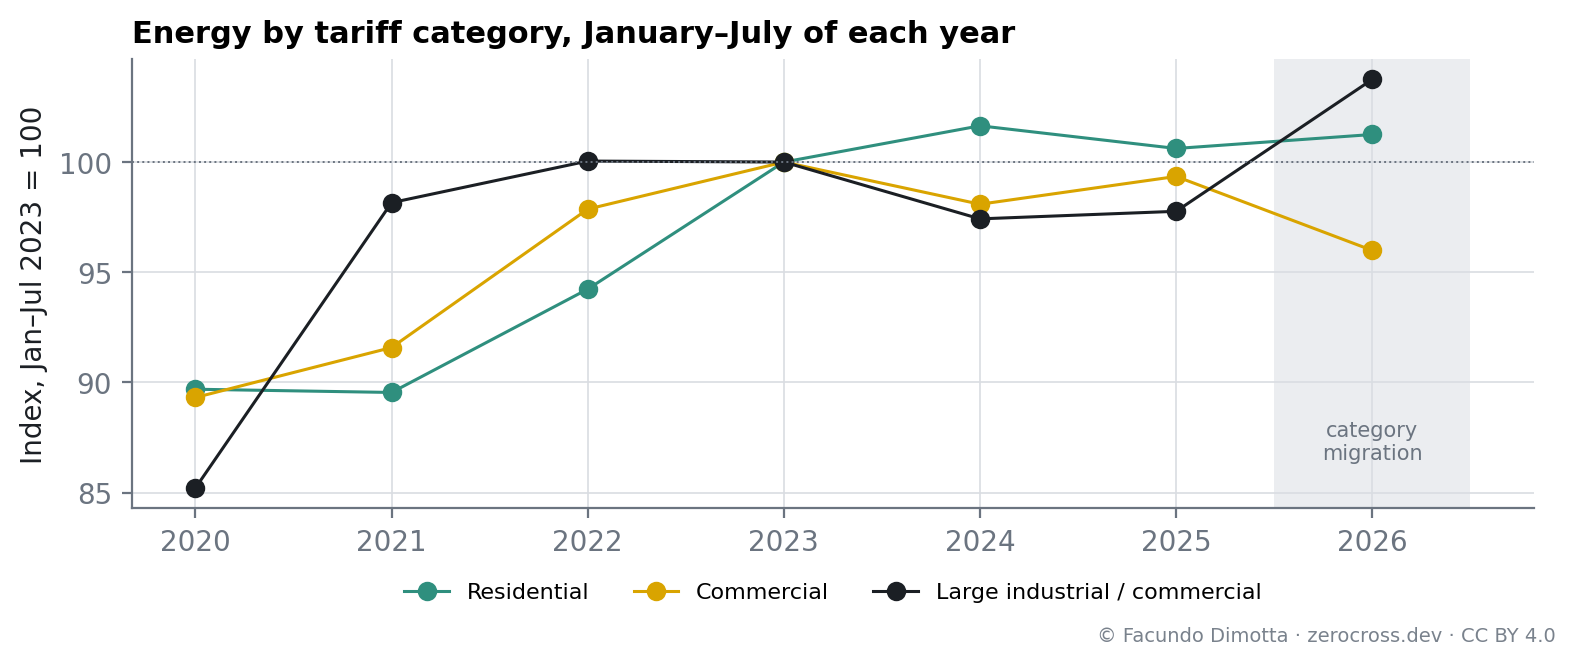
By tariff category, comparing January–July of each year (Figure 3):
- Large industrial and commercial users fell 2.6 % in 2024 and were flat in 2025: a moderate contraction, not a collapse. Their maximum was in 2022.
- Commercial users fell 1.9 % in 2024 and 3.4 % in 2026.
- Residential users grew until 2024 and have been roughly flat since.
In 2026 the categories are not comparable with previous years: with the reform of the wholesale market, users migrated between categories. Large users of distributors (GUDI) fell about 16 % while large users of the MEM grew, and a new category of distributor term contracts appeared, with about 1.5 % of the energy. An apparent 8 % growth of large MEM users in 2026 is largely this reclassification, not new industrial activity.
The rotation: who slowed down first
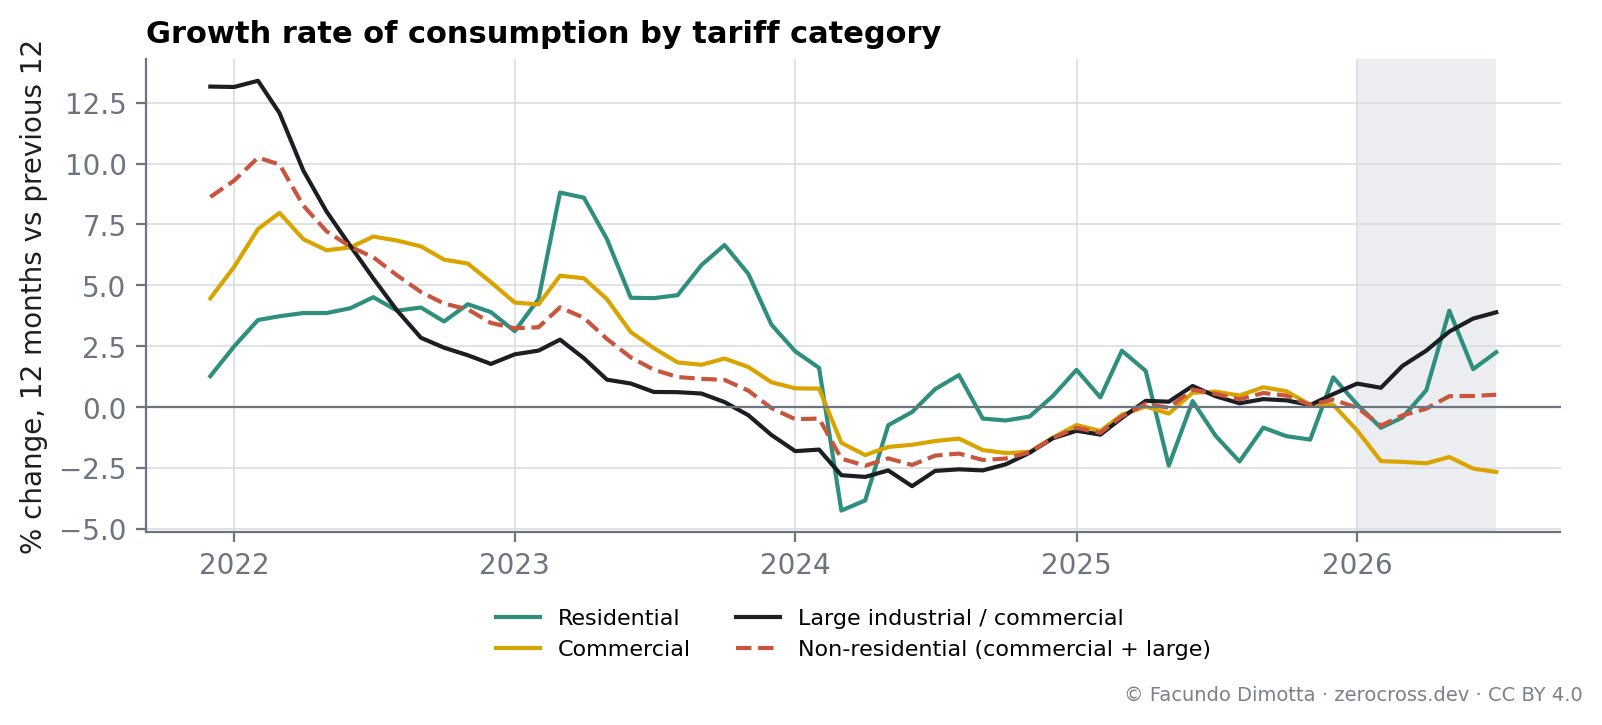
The growth rate of each category, the change of its last 12 months of consumption against the previous 12, shows the order of the slowdown (Figure 4):
- Large industrial and commercial users slowed down first. After the post-pandemic rebound (+13 % at the end of 2021), their growth fell below zero at the end of 2023 and bottomed at about −3 % in mid-2024.
- Commercial users followed, crossing zero in early 2024.
- Residential users were last: they were still growing 3–5 % a year during 2023 and only stalled in 2024.
- Since 2025 all categories hover around zero. In 2026 commercial falls and large users rise, largely because of the category migration; the non-residential total (commercial plus large users), which is not affected by it, stays close to zero.
The ten hypotheses
| Hypothesis | Test | Result |
|---|---|---|
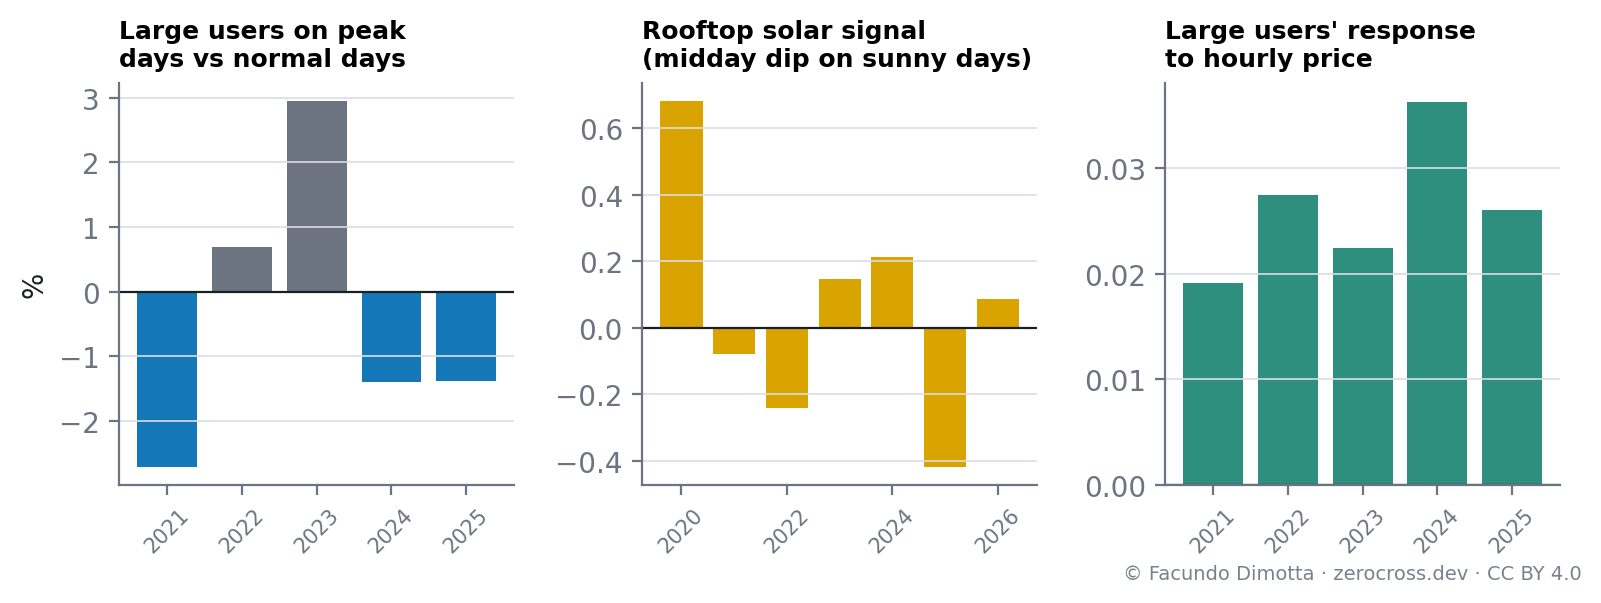
| More rooftop solar | If behind-the-meter PV were growing, distributors’ midday demand would drop more each year on sunny days than on cloudy ones | ❌ No trend: the midday dip on sunny days fluctuates around zero every year |
| Industrial slowdown | Energy of large industrial and commercial users | ⚠️ A moderate fall (−2.6 % in 2024, flat in 2025). It lowers the base, not specifically the summer peak |
| Peak-shaving programs for large users | Large users’ demand on the highest-demand summer days, against normal working days | ⚠️ About −1.4 % in 2024 and 2025 (+2.9 % in 2023): some tens of MW, far too little to explain the plateau |
| Hourly price signals | Response of large users’ demand to the hourly marginal cost, controlling for hour, day type and month | ❌ No response: demand is slightly higher when the price is higher, because both rise with system load. Besides, only large MEM users, about 13 % of demand, see an hourly price |
| More efficient appliances (inverter air conditioners) | Sensitivity of demand to heat, year by year | ❌ Not measurable: the MW per degree of heat did not fall significantly (first study) |
| LED lighting (public and residential) | If lighting consumption fell, distributors’ evening ramp around sunset would shrink year after year | ❌ No trend: the ramp stays roughly the same every year. Any saving from LED is offset by other evening loads |
| Industrial processes moved to night shifts | Night against daytime consumption of large users, working days | ❌ No: the ratio is stable, and slightly lower since 2024 |
| Remote and hybrid work | Shape of distributors’ morning demand on mild working days | ⚠️ A step between 2020 and 2021, stable since: a change of shape already consolidated, not an ongoing trend |
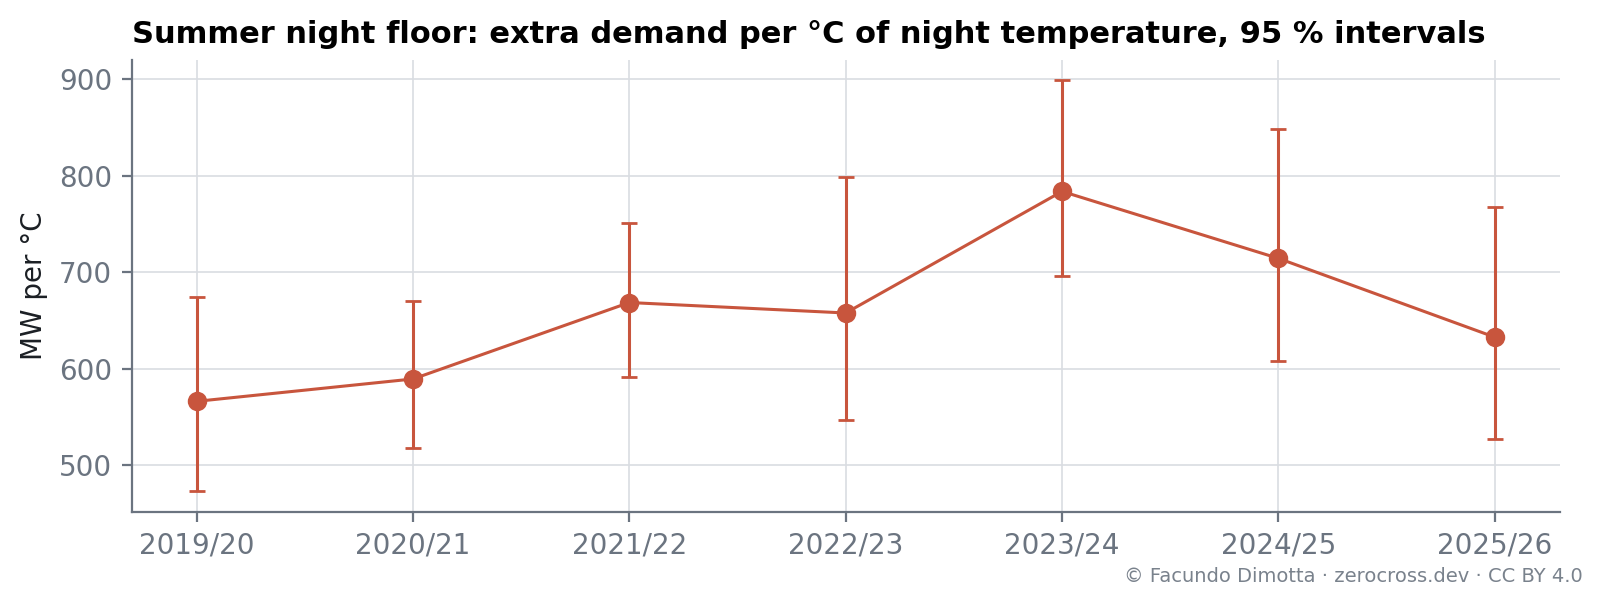
| Air conditioning on tropical nights | Summer night floor per °C of night temperature | ✅ It rose from about 570 MW per °C in 2019/20 to about 780 in 2023/24, a significant increase that raises the base. It has eased since (to about 630 in 2025/26), but that decline is within the uncertainty (Figure 5) |
| Tariff increases and household and commercial habits | Timing and location of the change | ✅ The most consistent: the plateau starts in 2023/24, when tariffs rose; it is concentrated in the distributors, whose customers see the whole bill but no hourly price; commercial consumption falls |
Discussion
- The flattening is real, but earlier and quieter than the 2026 record suggests. Summer afternoon demand at equal heat stopped growing after 2022/23, while the rest of the curve kept rising. The 2026 record was low mostly because of the weather.
- The most consistent explanation is the bill, not the hourly price. Households and businesses served by distributors never saw an hourly signal; what changed from 2024 was the size of the bill. Using less on hot afternoons (air conditioning, lighting, opening hours) is one of the simplest responses to a bigger bill, even if the national sensitivity per degree has not fallen measurably. The data are consistent with this explanation, but they cannot prove it: that would require consumption by customer type at hourly resolution.
- Market-based flattening has not arrived yet. Hourly prices reach only the largest users, and they show no measurable response. The market reform of October 2025 may change this; 2026 is too early and too disrupted by the category migration to tell.
- For planning, the lesson is that peak growth cannot be taken as a fixed percentage per year. Over the last three summers, peak demand at equal heat did not grow at all, while energy did.
Limitations
- 2026 covers January to July only.
- Demand at equal heat comes from a linear fit on each summer’s hot days; summers with few very hot days have wider intervals.
- Medium-size large users (GUME) are included in the distributors, so industry cannot be fully separated at hourly resolution.
- The tests show associations, not causes. In particular, the tariff explanation is the one most consistent with the timing, not a proven mechanism.
- Some plausible mechanisms cannot be tested with these data: maximum-demand charges in commercial and industrial tariffs, which push those users to flatten their own peaks; self-generation with diesel sets at peak hours; and distribution networks that, on the most extreme days, limit the demand actually served through voltage drops and protection trips, so that the measured peak is lower than the demand that would have occurred.
Data: this study analyses electricity market data and shows only the results of that analysis (estimates, error measures, statistics, indices and conclusions), not the underlying data; sources and terms of use on the legal page. Weather: Open-Meteo.com and ERA5, Copernicus Climate Change Service (CC BY 4.0).
Reuse
Citation
@online{dimotta2026,
  author = {Dimotta, Facundo},
  title = {Is the {Argentine} {Load} {Curve} {Flattening?} {Ten}
    {Hypotheses} {Tested}},
  date = {2026-10-20},
  url = {https://zerocross.dev/posts/2026-10-20-sadi-load-curve-flattening/},
  langid = {en}
}